HMI flows planned before interface work
Operator tasks, device groups, alarms and actions are mapped before screens become crowded or misleading for daily teams.
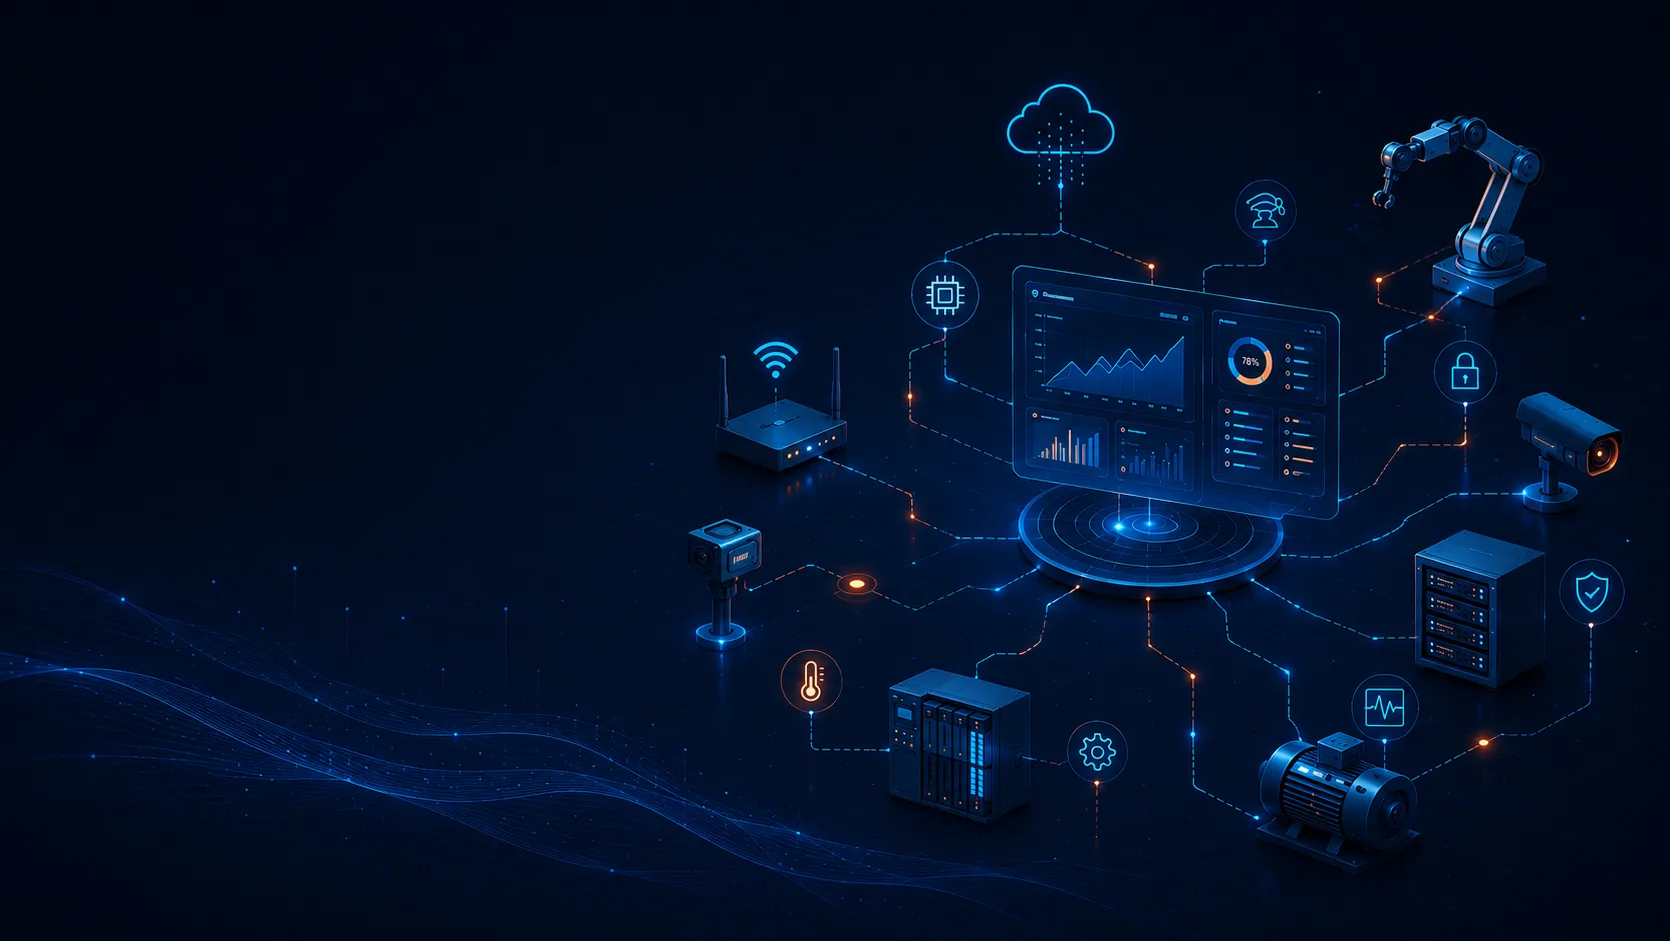
Cloud HMI for CPS data
Web HMI interfaces with telemetry, alerts, secure roles, APIs and cloud-ready backend.
HMI, telemetry, alerts, APIs
We turn device data, alerts, roles and workflows into cloud HMI interfaces operators can understand.
Cloud HMI and CPS web interfaces help teams see equipment state, telemetry, alerts and operational data without turning complex systems into confusing dashboards.
Kavita Systems starts by understanding the system behind the screen: users, roles, device groups, signals, data sources, update frequency, alarm rules, history needs, backend APIs, cloud or edge constraints and deployment model. The goal is to define what operators, supervisors, service teams and clients need to see or act on.
This work can start with a new HMI, monitoring portal, CPS MVP or remote operations dashboard. It can also support scaling work, where more devices, users, events, reports or integrations make the old interface harder to trust. For existing products, we can help clean up data display issues, slow screens, API errors, inconsistent alerts and legacy PHP dashboards.
Architecture is selected after discovery. A decoupled frontend and backend can fit cloud HMI products with separate release needs. A headless or API-first backend can serve web dashboards, mobile access, admin tools and external systems. A modular Laravel core or Inertia.js monolith can work well for internal portals, operator panels and reporting tools.
We use Laravel, Vue, Nuxt, React, Next, Inertia, TypeScript, Tailwind, REST, GraphQL, PostgreSQL, Redis, Docker, cloud tools, Figma, Storybook and AI providers only when they fit the product. The web interface can monitor, visualize, guide and send allowed actions, but safety-critical control loops must remain at the proper industrial or embedded level.
Kavita Systems treats HMI as an operational interface, not only UI. We clarify users, data, update frequency, alarms, risks, APIs, deployment and support, then connect UX/UI, frontend, backend, telemetry, roles, async behavior, QA and launch through visible milestones.
Cloud HMI & CPS
Interfaces
Data & Analytics
Dashboards
Internal Tools &
Admin Platforms
API-First & Developer
Platforms
AI Dashboards &
Copilot Interfaces
AI Automation
Products
Cloud & DevOps
Solutions
DevTools &
Engineering Tools
Logistics & Supply Chain
Platforms
RetailTech, Inventory &
POS Systems
Property
Platforms
Design Systems &
Component Libraries
Operator tasks, device groups, alarms and actions are mapped before screens become crowded or misleading for daily teams.
Signals, timestamps, stale states and event history are reviewed so telemetry becomes readable and useful in the UI later.
Users see allowed actions, alarm status and review needs because access rules are planned before production work starts.
Laravel or another backend layer keeps device data, users, logs, integrations and permissions controlled for support later.
Live, delayed, failed and queued states are designed explicitly, so operators know how much they can trust the screen clearly.
After release, we help tune alerts, review logs, fix API issues and plan the next dashboard or integration improvement later.
Telemetry, UX, safe operations
Cloud HMI and CPS web interface work should begin with the operational reality, not with a dashboard layout. The web layer may show telemetry, alarms, device groups, reports and allowed actions, but it should not pretend to replace the industrial, embedded or edge systems that own safety-critical control. We design the interface around visibility, trust, review and support.
Discovery combines technical data with operator context. We review devices, signals, timestamps, update frequency, gateway behavior, storage needs, alarm rules, event history, APIs, cloud or edge constraints, user roles and support routines. We also ask what happens when data is missing, stale, duplicated or late. A misleading current state can be worse than no state, so the interface must explain how much the user can trust what they see.
Workflow mapping separates users before screens become crowded. Operators may need status, alerts and clear next actions. Supervisors may need acknowledgements, reports and trends. Service teams may need diagnostics, logs and device context. Clients may need selected read-only views. Admins may need roles, thresholds and integration settings. Mapping these needs early prevents one overloaded control-room screen from trying to serve every audience at once.
Figma helps test readability under pressure. HMI screens need strong hierarchy, sensible density, clear severity states, responsive behavior and predictable interaction. Figma Agents can help explore alternatives for outdated monitoring layouts. Figma MCP can bring approved design context closer to Vue, React, Nuxt, Next or Inertia implementation, but engineering still decides how real-time state, permissions, delayed data and backend contracts are handled safely.
Architecture follows the data flow and risk level. A modular Laravel backend can work well for users, roles, API normalization, reports, queues, files, alerts and admin tools. Inertia.js can be enough for internal operator portals. Decoupled, headless or API-first architecture may fit separate frontend releases, mobile access, partner systems or multiple device sources. Real-time features, polling, queues and scheduled refreshes are chosen per workflow, not because every value must move live.
Implementation should make operational data understandable. Backend work may normalize device responses, store events, process webhooks, run jobs, manage logs, enforce roles and expose predictable API contracts. Frontend work turns that into states people can read: normal, warning, critical, offline, delayed, failed, queued, acknowledged or waiting for review. The browser should not be the control loop. Sensitive actions need backend checks, audit trails and clear confirmation.
Alerts require their own product design. A useful HMI interface should show severity, source, timing, history, acknowledgement status, comments and cleared states without forcing users into raw logs. Duplicate events, delayed notifications, escalation paths and support review should be planned before launch. Cloudflare, Redis, queues, relational storage, logging and monitoring can support the operational layer when they match the system's needs.
AI can help only where it does not blur responsibility. A Laravel AI-ready backend may prepare clean data, queues, service layers and permission boundaries for future features. AI-integrated modules may summarize incidents, draft maintenance notes, search documentation, classify support requests or prepare reports through Laravel AI SDK, OpenAI, Claude, Gemini or another provider. AI-native agents and MCP-compatible tools need stronger review. AI suggestions should stay separate from safety-critical control decisions.
AI-assisted development can support engineering, not replace it. Coding agents can inspect dashboard code, compare API behavior, suggest regression tests and help reason about telemetry edge cases. Laravel Boost can improve framework context during backend work. These tools are useful with senior review, but they do not decide alarm rules, access policy, command behavior, data ownership or deployment safety. Those decisions stay with engineers and product owners who understand the operational risk.
QA is based on operational trust. We test login, roles, device groups, telemetry display, stale data labels, alert states, acknowledgements, API errors, missing values, delayed updates, responsive screens, queued work, logs and deployment settings. AI-assisted tests can help generate regression cases, but manual review is still needed where a wrong screen could confuse users. Before launch, we prepare staging data, monitoring, release checks and support handover.
After launch, the interface should keep improving with the operation. Support may include alert tuning, device group changes, performance work, log review, reporting, API fixes, cloud or edge adjustments and new modules. Kavita Systems keeps work visible through project calls, tracked milestones, demos, review notes and release care. The business value is a web HMI layer that helps teams understand connected operations without losing control of risk.
Practical tools for real releases. A focused mix of design, app frameworks, data tools, automation, hosting, and quality checks selected around each product.
Design operator flows, status cards, alarms and table filters.
Figma / Flows / Dashboards UX
Turn telemetry, device groups, events into readable screens.
Telemetry / Status / Events UI
Connect device data, backend services and HMI API responses.
REST / GraphQL / Data Flow API
Plan device records, logs, queues, reports and data retention.
PostgreSQL / Redis / Logs Data
Define roles, permissions, audits and backend safety actions.
Roles / Permissions / Safety
Design alarm severity, acknowledgements, history and alerts.
Alarms / Webhooks / History Logs
Prepare staging, Docker, CI/CD, monitoring and HMI notes now.
Docker / CI/CD / Cloud Release
Test flows, API errors, permissions, logs and routines well.
Testing / Monitoring / Fixes QA
Some work is public, while many long-term client systems remain private under NDA.
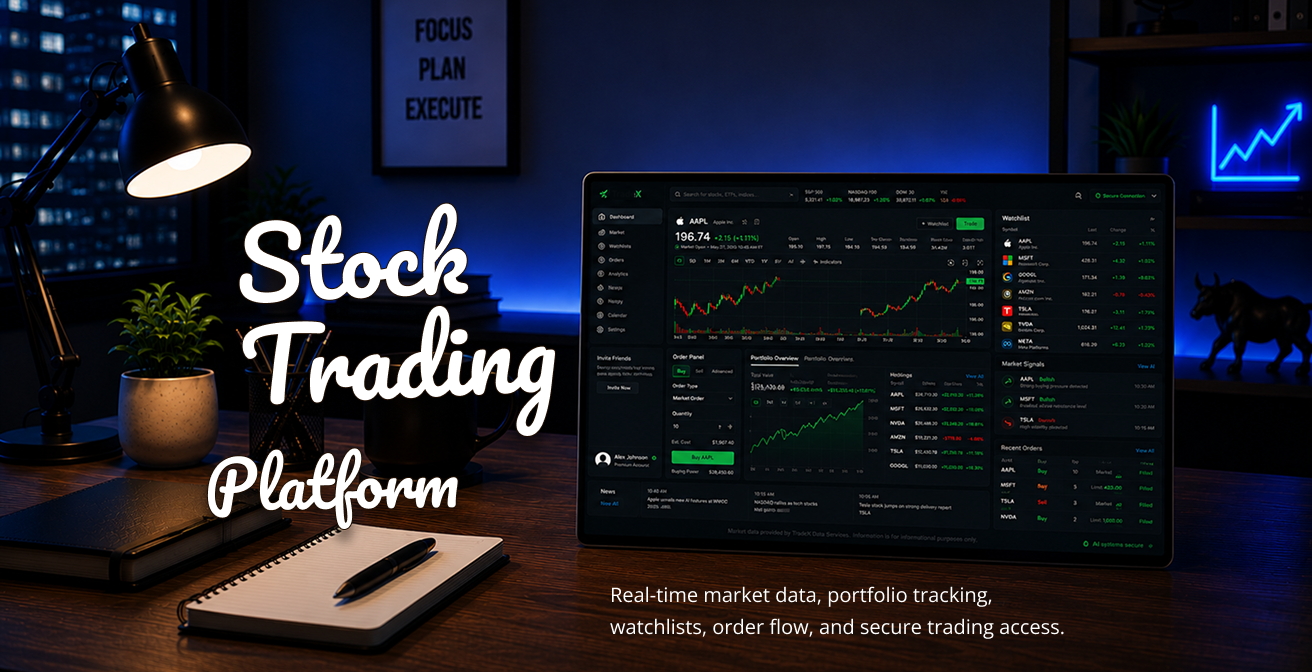
Years active: 2025 - in progress
Stock trading platform for buying and selling shares with real-time market data, portfolio tracking and secure account workflows.
Key points: live quotes, order flow, watchlists, market signals, portfolio analytics, user dashboards, transaction history and security-focused access.
Yes. We can start with the data you already have. Usually the first step is to understand what devices send, how often the data updates, which values matter to operators, what should trigger attention, and who needs to see what. From there, we can shape the first HMI scope, dashboard structure, data flow, and backend plan. The goal is to make the first version useful before adding more screens and rules.
A normal dashboard often shows business metrics. A Cloud HMI has to support operational decisions. It needs to show device state, telemetry, alarms, stale data, event history, permissions, and sometimes allowed actions. The interface must help people understand what is happening now, what changed, and what needs attention. That means UX is planned around operator work, not just charts on a screen.
Yes. Many old HMI and monitoring tools start as useful internal systems, then become hard to trust or maintain over time. We can review the current screens, data sources, APIs, alerts, user roles, performance issues, and support problems. After that, we can suggest what to keep, what to clean up, and what should be rebuilt in a more stable web architecture without stopping daily operations too early.
We start with priority, not layout. An operator should not have to search through crowded screens to understand whether something is normal, delayed, failed, offline, warning-level, or critical. We map the main situations first, then design status cards, tables, filters, alerts, and history views around those decisions. The goal is to make the interface readable under pressure, especially when several issues happen at the same time.
We make data freshness visible. Some values may update in real time, some every few seconds, some through scheduled syncs, and some only when a device reconnects. The interface should show when data was last updated and whether the user can trust it. This is especially important for CPS dashboards, because delayed data can be more dangerous than no data if it looks current to the operator during active work.
Yes. Alerts and event history are usually a core part of this type of product. We can design alarm severity, acknowledgement flows, repeated events, delayed alerts, cleared states, comments, filters, logs, and notification behavior. The goal is not only to show that something happened, but to help the team understand what happened, when, who saw it, and what was done about it without searching through raw logs.
We define who can see data, who can act on it, and who can change settings. For example, an operator may need live status and alerts. A supervisor may need reports and acknowledgements. A service team may need diagnostics. A client may only need selected read-only views. These rules should be controlled in the backend, not only hidden in the interface, so access stays reliable after release and future team changes.
Sometimes, but this needs to be handled carefully. A web interface can monitor, guide, approve, or trigger allowed actions when the system architecture supports it. But safety-critical control should stay at the proper industrial, embedded, or edge level. For web HMI work, we separate monitoring, user actions, permissions, logs, and safety-sensitive control paths before development starts or any operator action reaches production.
Yes, when real-time behavior is actually needed. Some screens need live updates through websockets or similar methods. Other parts can work better with polling, background jobs, queues, or scheduled refreshes. Not every value needs to be live all the time. The right approach depends on how often the data changes, how critical it is, and what users need to do with it during normal and unusual situations.
Yes. We can work with existing APIs, device gateways, backend services, databases, webhooks, files, or third-party platforms. Before building the UI, we review what each system sends, how data is formatted, what can fail, how errors are logged, and which system is the source of truth. This helps avoid building a nice-looking interface on top of unreliable data flow or unclear ownership between systems.
We plan deployment around the real environment. Some products are fully cloud-based. Others need edge components, private networks, device gateways, restricted access, VPNs, or special hosting rules. We look at these constraints early so the interface, backend, APIs, logs, queues, and monitoring fit the way the system will actually run. Deployment should support operations, not surprise them after launch.
We test the workflows where mistakes would matter most. That can include login, roles, device groups, telemetry display, stale data, alert states, acknowledgements, API errors, responsive screens, background jobs, logs, and deployment setup. We also check how the interface behaves when data is missing, delayed, duplicated, or incorrect. For HMI products, testing is about operational trust, not only visual QA.
After launch, the system usually needs tuning. Real users may ask for clearer alerts, better filters, new device groups, reports, faster screens, improved logs, or new integrations. We can help review feedback, fix release issues, improve data handling, and plan the next version without disrupting the working system. The first release should make operations clearer, not harder to support or extend.
Hourly Rate
Senior talent by role.
Specialists
Matched to your project.
Tracked Hours
Verified Upwork history.
Min. Budget
Trusted since 2015.